Analysis and Studies - Country Analysis
Comparison Japan/United States: a look at the market
December 5th 2023
Comparison Japan/United States
Japan-United States
In 2021, Japan exported $128 billion to United States. The chief products that Japan exported to United States are Cars ($32.9B), Motor vehicles; parts and accessories ($7.51B), and Large Construction Vehicles ($4.25B).
During the last 26 years the exports of Japan to United States have escalated at an annualized rate of 0.26%, from $120 billion in 1995 to $128 billion in 2021.
In 2009, Japan exported services to United States worth $72.8B, with Services not allocated ($35.5B), Other business services ($16.9B), and Royalties and license fees ($8.5B) being the largest in terms of value.
United States-Japan
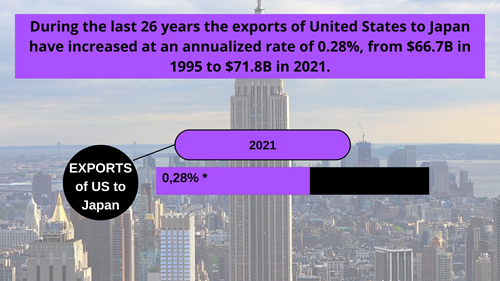
In 2021, United States exported $71.8B to Japan. The main products that United States exported to Japan were Petroleum Gas ($8.76B), Packaged Medicaments ($3.14B), and Corn ($3.11B). During the last 26 years the exports of United States to Japan have increased at an annualized rate of 0.28%, from $66.7B in 1995 to $71.8B in 2021.
What’s more in 2017, United States exported services to Japan worth $47.1B, with Other business services ($9.67B), Travel ($9.01B), and Transportation ($8.01B) being the largest in terms of value.
Comparison
In 2021, Japan ranked 1 in the Economic Complexity Index (ECI 2.06), and 4 in total exports ($731B). That same year, United States ranked 10 in the Economic Complexity Index (ECI 1.46), and 2 in total exports ($1.63T).
About latest trends
In August 2023, Japan exported ¥1.62T and imported ¥968B from United States, outcoming in a positive trade balance of ¥650B.
Between August 2022 and August 2023 the exports of Japan have increased by ¥78.8B (5.12%) from ¥1.54T to ¥1.62T, while imports decreased by ¥-100B (-9.4%) from ¥1.07T to ¥968B.
Trade
In August 2023, the top exports of Japan to United States were Cars (¥272B), Commodities not elsewhere specified (¥58.6B), Motor vehicles; parts and accessories (8701... (¥56.9B), Machines and apparatus of a kind... (¥50.8B), and Large Construction Vehicles (¥41.7B).
In August 2023 the top imports of Japan from United States were Petroleum Gas (¥114B), Vaccines, blood, antisera, toxins and cultures (¥44.4B), Integrated Circuits (¥29.5B), Gas Turbines (¥28.1B), and Corn (¥26.5B).
In August 2023 the exports of Japan were mainly from Aichi (¥484B), Chiba (¥191B), Kanagawa (¥163B), Tokyo (¥145B), and Osaka (¥141B), while imports destinations were mainly Chiba (¥370B), Tokyo (¥129B), Osaka (¥78.2B), Aichi (¥74B), and Kanagawa (¥71.4B).
Growth
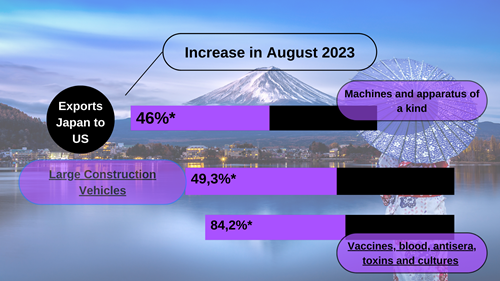
In August 2023, the increase in Japan's year-by-year exports to United States was illustrated mostly by an increase in product exports in Machines and apparatus of a kind...(46%), Large Construction Vehicles (49.3%), and Vaccines, blood, antisera, toxins and cultures (84.2%).
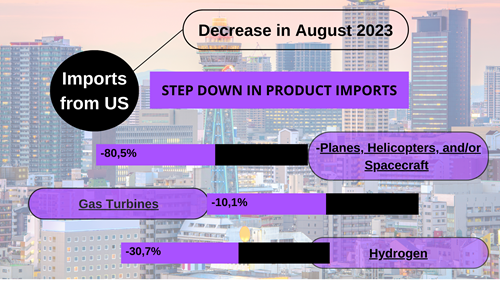
Even so, in August 2023, the decrease in Japan's year-by-year imports from United States was made clear primarily by a step-down in product imports in Planes, Helicopters, and/or Spacecraft ( -80.5%), Gas Turbines (-10.1%), and Hydrogen (-30.7%).
Fonti:
https://oec.world/en
https://data.worldbank.org/
https://www.trademap.org/