Analysis and Studies - Products analysis
Bicycle production in the EU: an overview of the market
September 22nd 2023
In the year 2022, bicycle production in the European Union reached a notable milestone, totaling 14.7 million units. This figure represented a significant upswing, with a 10% increase when compared to the previous year, 2021, and a remarkable 29% surge over the span of a decade, from 2012 to 2022.
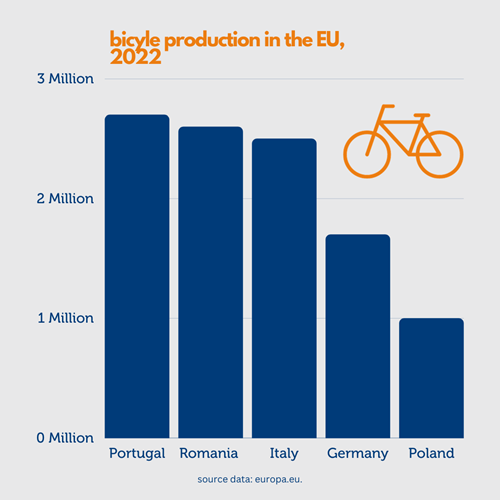 Breaking down the production figures by country, Portugal emerged as the largest producer in 2022, manufacturing an impressive 2.7 million bicycles. Following closely behind was Romania, producing 2.6 million units, while Italy contributed 2.5 million bicycles. Germany and Poland also made substantial contributions to the overall production, manufacturing 1.7 million and 1.0 million bicycles, respectively.
Beyond the economic implications of bicycle production, cycling itself plays a crucial role in fostering individual health and overall well-being. Furthermore, it offers a sustainable solution to reduce air pollution, particularly by potentially replacing private car usage. As such, cycling stands as an eco-friendly and health-conscious mode of transportation that not only contributes to personal fitness but also addresses broader environmental concerns, making it a valuable component of modern mobility solutions in the European Union.
 In 2022, the European Union saw bicycle exports, including both electric and non-electric models, reach a total value of €1.1 billion. This marked a substantial 22% increase compared to the previous year, 2021. However, imports in the same year significantly outpaced exports, totaling €2.5 billion, reflecting a robust 32% growth. The notable rise in the overall trade value of bicycles can be largely attributed to an uptick in the trade of electric bicycles, which tend to carry higher price tags due to their technological components and features.
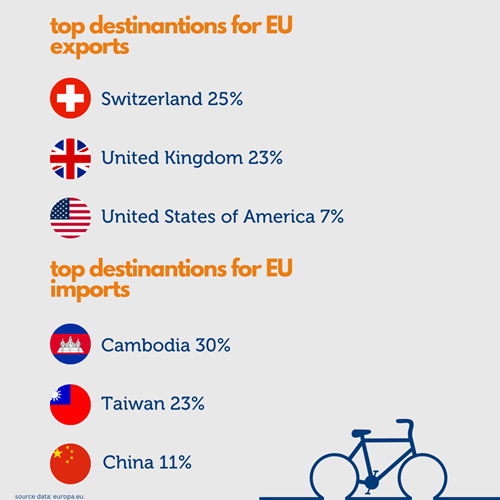
In 2022, the primary destination for non-electric bicycle exports from the European Union was Switzerland, accounting for 25% of the total exports to destinations outside the EU in terms of value. It was closely followed by the United Kingdom at 23% and the United States at 7%.
Conversely, when it comes to non-electric bicycle imports into the EU, the majority came from various countries, with Cambodia leading the way, contributing 30% of the total extra-EU imports. Taiwan followed at 23%, with China at 11%, Bangladesh at 10%, and Türkiye at 6% as the other significant sources of imports